Companies using Lucky Orange
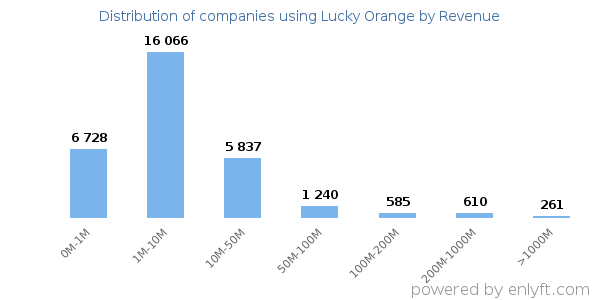
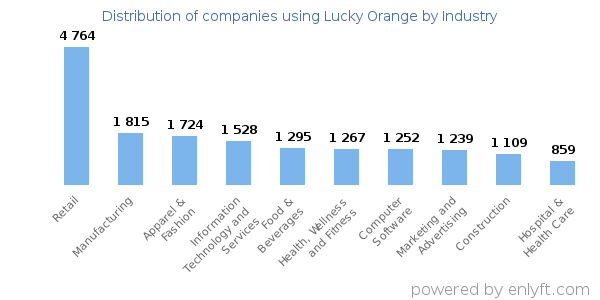
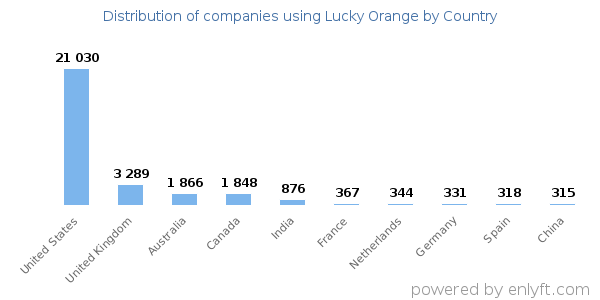
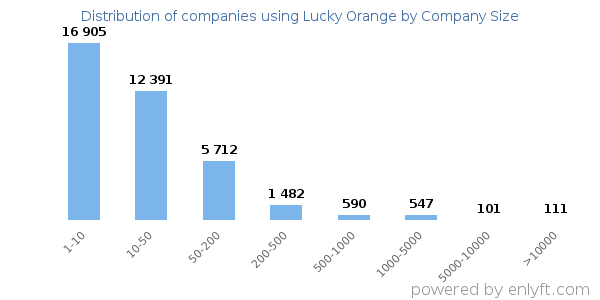
We have data on 47,920 companies that use Lucky Orange. The companies using Lucky Orange are most often found in United States and in the Retail industry. Lucky Orange is most often used by companies with 1-10 employees and 1M-10M dollars in revenue. Our data for Lucky Orange usage goes back as far as 8 years and 1 months.
If you’re interested in the companies that use Lucky Orange, you may want to check out Google Analytics and Facebook Pixel as well.
Who uses Lucky Orange?
| Company | Fusion IT |
| Website | fusion-it.net |
| Country | United States |
| Revenue | 1M-10M |
| Company Size | 10-50 |
| Company | Searchspring |
| Website | searchspring.com |
| Country | United States |
| Revenue | 10M-50M |
| Company Size | 50-200 |
| Company | Cohesity |
| Website | cohesity.com |
| Country | United States |
| Revenue | 200M-1000M |
| Company Size | 1000-5000 |
| Company | SaaSOptics |
| Website | saasoptics.com |
| Country | United States |
| Revenue | 10M-50M |
| Company Size | 10-50 |
| Company | VenueNext |
| Website | venuenext.com |
| Country | United States |
| Revenue | 10M-50M |
| Company Size | 10-50 |
| Company | Website | Country | Revenue | Company Size |
|---|---|---|---|---|
| Fusion IT | fusion-it.net | United States | 1M-10M | 10-50 |
| Searchspring | searchspring.com | United States | 10M-50M | 50-200 |
| Cohesity | cohesity.com | United States | 200M-1000M | 1000-5000 |
| SaaSOptics | saasoptics.com | United States | 10M-50M | 10-50 |
| VenueNext | venuenext.com | United States | 10M-50M | 10-50 |
Target Lucky Orange customers to accomplish your sales and marketing goals.
Lucky Orange Market Share and Competitors in Enterprise Marketing Management
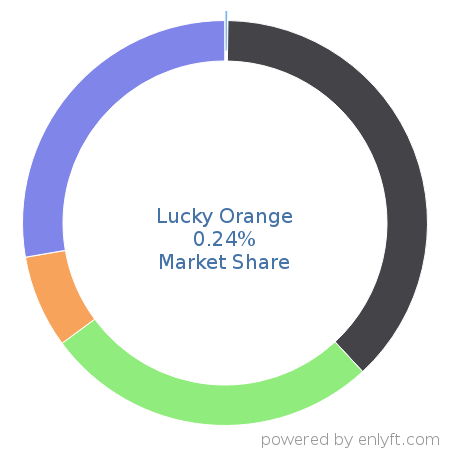
We use the best indexing techniques combined with advanced data science to monitor the market share of over 15,000 technology products, including Enterprise Marketing Management. By scanning billions of public documents, we are able to collect deep insights on every company, with over 100 data fields per company at an average. In the Enterprise Marketing Management category, Lucky Orange has a market share of about 0.3%. Other major and competing products in this category include:
Enterprise Marketing Management

What is Lucky Orange?
Lucky Orange is a tool that quickly see who is on site and interact with them in many ways, chat with visitors on site, actually watch their mouse move around the screen and click in real time, play them back as recording, generate beautiful heat maps of clicks, mouse movements (eye tracking), and scroll depth, create quick insightful polls, and more.
Top Industries that use Lucky Orange
Looking at Lucky Orange customers by industry, we find that Retail (10%) is the largest segment.
Top Countries that use Lucky Orange
52% of Lucky Orange customers are in United States and 8% are in United Kingdom.
Distribution of companies that use Lucky Orange based on company size (Employees)
Of all the customers that are using Lucky Orange, a majority (65%) are small (<50 employees), 10% are large (>1000 employees) and 25% are medium-sized.
Distribution of companies that use Lucky Orange based on company size (Revenue)
Of all the customers that are using Lucky Orange, a majority (74%) are small (<$50M), 6% are large (>$1000M) and 14% are medium-sized.
