Data Visualization products
77,527 Companies
What is Data Visualization?
Data visualization is a modern equivalent of visual communication that involves the creation and study of the visual representation of data, meaning "information that has been abstracted in some schematic form, including attributes or variables for the units of information". A primary goal of data visualization is to communicate information clearly and efficiently via statistical graphics, plots and information graphics.
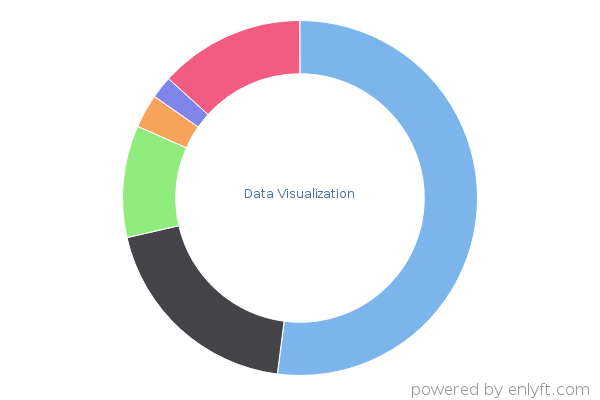
Market Share of Data Visualization products
At enlyft, we use sophisticated, patent-pending algorithms to track the use of various Data Visualization products and technologies. We track 29 products in the Data Visualization category, and have found 77,527 companies using these products.


Target customers using Data Visualization products to accomplish your sales and marketing goals.
| Product |
Install base
# of companies we found using this product |
Market Share |
|---|---|---|
| Segment | 39,849 | 51% |
| Google Charts | 14,075 | 18% |
| amCharts | 8,520 | 10% |
| Kibana | 2,882 | < 5% |
| Chart.Js | 2,011 | < 5% |
| SAS/GRAPH | 1,691 | < 5% |
| SAP Lumira | 1,530 | < 5% |
| Apache Superset | 1,245 | < 5% |
| Gephi | 1,145 | < 5% |
| Infogram | 1,120 | < 5% |
| Tableau Public | 803 | < 5% |
| FusionCharts Suite XT | 789 | < 5% |
| Datawrapper | 378 | < 5% |
| FusionCharts | 321 | < 5% |
| Graphviz | 287 | < 5% |
| VMware Cloud Director | 176 | < 5% |
| Roambi | 140 | < 5% |
| Oracle AutoVue | 108 | < 5% |
| AnyChart | 77 | < 5% |
| Opendatasoft | 74 | < 5% |
| Cognos Visualizer | 61 | < 5% |
| 3DEXPERIENCE Platform | 54 | < 5% |
| SAP Crystal Dashboard Design | 41 | < 5% |
| VoxelGeo | 39 | < 5% |
| BIOVIA Pipeline Pilot | 36 | < 5% |
| Nevron | 29 | < 5% |
| SAP Visual Intelligence | 25 | < 5% |
| Kumu | 11 | < 5% |
| Preset | 10 | < 5% |


