Companies using SAS/GRAPH
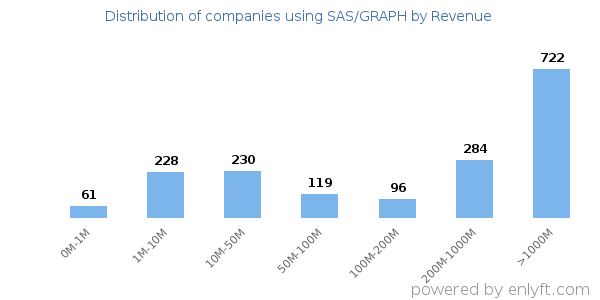
We have data on 1,691 companies that use SAS/GRAPH. The companies using SAS/GRAPH are most often found in United States and in the Information Technology and Services industry. SAS/GRAPH is most often used by companies with >10000 employees and >1000M dollars in revenue. Our data for SAS/GRAPH usage goes back as far as 9 years and 5 months.
If you’re interested in the companies that use SAS/GRAPH, you may want to check out Segment and Google Charts as well.
Who uses SAS/GRAPH?
| Company | SAP SE |
| Website | sap.com |
| Country | United States |
| Revenue | >1000M |
| Company Size | >10000 |
| Company | Accenture PLC |
| Website | accenture.com |
| Country | Ireland |
| Revenue | >1000M |
| Company Size | >10000 |
| Company | University of Arizona |
| Website | arizona.edu |
| Country | United States |
| Revenue | >1000M |
| Company Size | >10000 |
| Company | Infosys Ltd |
| Website | infosys.com |
| Country | India |
| Revenue | >1000M |
| Company Size | >10000 |
| Company | HP Development Company, L.P. |
| Website | hp.com |
| Country | United States |
| Revenue | >1000M |
| Company Size | >10000 |
| Company | Website | Country | Revenue | Company Size |
|---|---|---|---|---|
| SAP SE | sap.com | United States | >1000M | >10000 |
| Accenture PLC | accenture.com | Ireland | >1000M | >10000 |
| University of Arizona | arizona.edu | United States | >1000M | >10000 |
| Infosys Ltd | infosys.com | India | >1000M | >10000 |
| HP Development Company, L.P. | hp.com | United States | >1000M | >10000 |
Target SAS/GRAPH customers to accomplish your sales and marketing goals.
SAS/GRAPH Market Share and Competitors in Business Intelligence
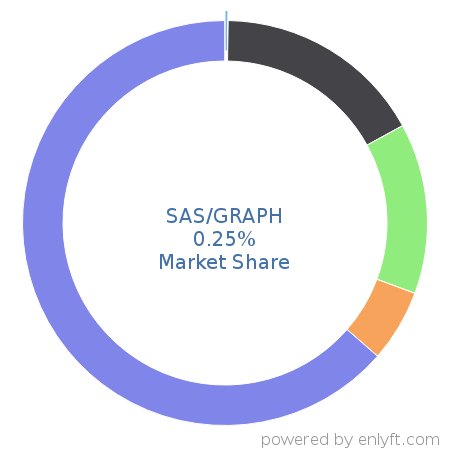
We use the best indexing techniques combined with advanced data science to monitor the market share of over 15,000 technology products, including Business Intelligence. By scanning billions of public documents, we are able to collect deep insights on every company, with over 100 data fields per company at an average. In the Business Intelligence category, SAS/GRAPH has a market share of about 0.2%. Other major and competing products in this category include:
Business Intelligence

What is SAS/GRAPH?
SAS/GRAPH software creates and delivers accurate, high-impact visuals that enable decision makers to gain a quick understanding of critical business issues.
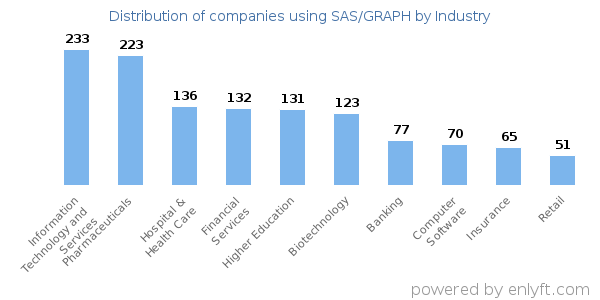
Top Industries that use SAS/GRAPH
Looking at SAS/GRAPH customers by industry, we find that Information Technology and Services (13%), Pharmaceuticals (11%), Hospital & Health Care (8%), Higher Education (7%), Financial Services (7%) and Biotechnology (6%) are the largest segments.
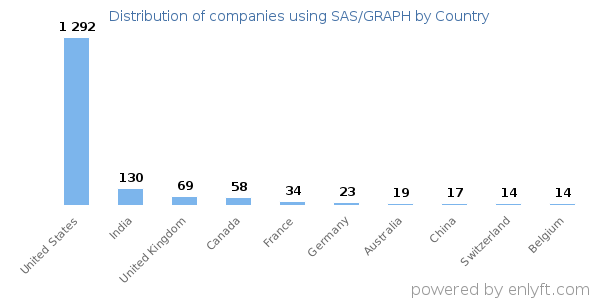
Top Countries that use SAS/GRAPH
72% of SAS/GRAPH customers are in United States and 7% are in India.
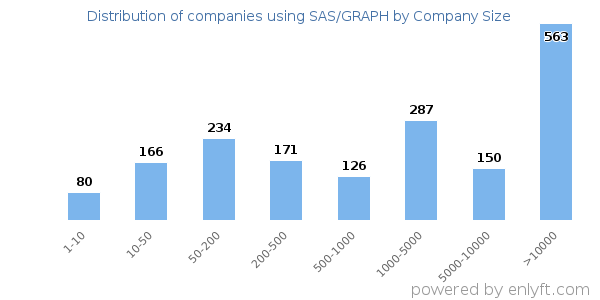
Distribution of companies that use SAS/GRAPH based on company size (Employees)
Of all the customers that are using SAS/GRAPH, a majority (55%) are large (>1000 employees), 14% are small (<50 employees) and 31% are medium-sized.
Distribution of companies that use SAS/GRAPH based on company size (Revenue)
Of all the customers that are using SAS/GRAPH, a majority (55%) are large (>$1000M), 26% are small (<$50M) and 14% are medium-sized.
