Companies using Visual KPI
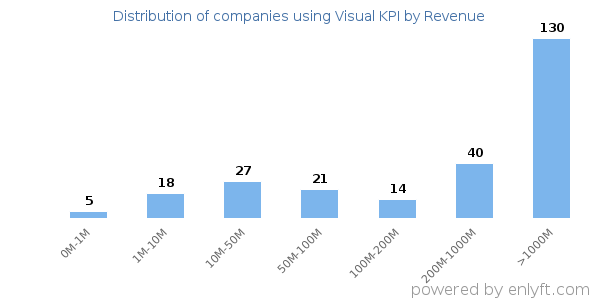
We have data on 237 companies that use Visual KPI. The companies using Visual KPI are most often found in United States and in the Automotive industry. Visual KPI is most often used by companies with >10000 employees and >1000M dollars in revenue. Our data for Visual KPI usage goes back as far as 7 years and 7 months.
If you’re interested in the companies that use Visual KPI, you may want to check out Tableau and Microsoft power BI as well.
Who uses Visual KPI?
| Company | HP Development Company, L.P. |
| Website | hp.com |
| Country | United States |
| Revenue | >1000M |
| Company Size | >10000 |
| Company | Amazon.com, Inc. |
| Website | amazon.com |
| Country | United States |
| Revenue | >1000M |
| Company Size | >10000 |
| Company | Asurion |
| Website | asurion.com |
| Country | United States |
| Revenue | >1000M |
| Company Size | >10000 |
| Company | AT&T Inc |
| Website | att.com |
| Country | United States |
| Revenue | >1000M |
| Company Size | >10000 |
| Company | HCL Infosystems Ltd. |
| Website | hclinfosystems.com |
| Country | India |
| Revenue | 200M-1000M |
| Company Size | >10000 |
| Company | Website | Country | Revenue | Company Size |
|---|---|---|---|---|
| HP Development Company, L.P. | hp.com | United States | >1000M | >10000 |
| Amazon.com, Inc. | amazon.com | United States | >1000M | >10000 |
| Asurion | asurion.com | United States | >1000M | >10000 |
| AT&T Inc | att.com | United States | >1000M | >10000 |
| HCL Infosystems Ltd. | hclinfosystems.com | India | 200M-1000M | >10000 |
Target Visual KPI customers to accomplish your sales and marketing goals.
Visual KPI Market Share and Competitors in Business Intelligence
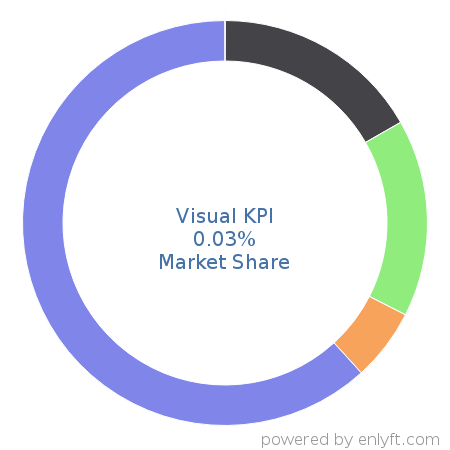
We use the best indexing techniques combined with advanced data science to monitor the market share of over 15,000 technology products, including Business Intelligence. By scanning billions of public documents, we are able to collect deep insights on every company, with over 100 data fields per company at an average. In the Business Intelligence category, Visual KPI has a market share of about 0.1%. Other major and competing products in this category include:
Business Intelligence

What is Visual KPI?
Visual KPI reads multiple data sources in real-time (big data, historians, databases, manual data, web services and more) and adds context with KPIs, groups/hierarchy, alerts, and geo location.
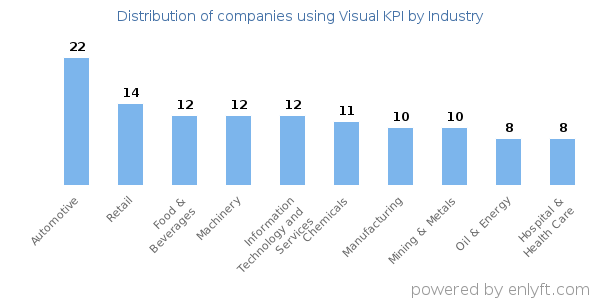
Top Industries that use Visual KPI
Looking at Visual KPI customers by industry, we find that Automotive (9%) and Retail (5%) are the largest segments.
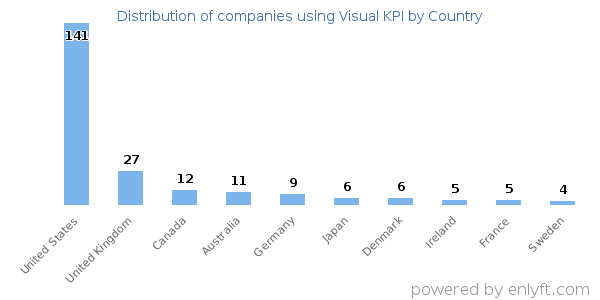
Top Countries that use Visual KPI
54% of Visual KPI customers are in United States, 11% are in United Kingdom and 5% are in Canada.
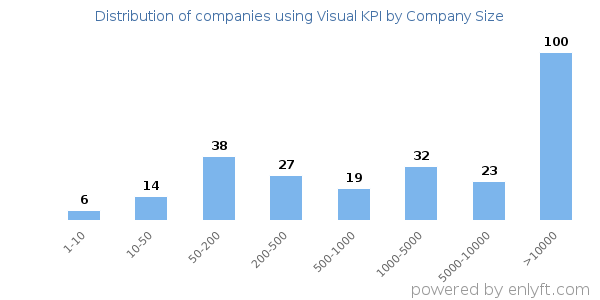
Distribution of companies that use Visual KPI based on company size (Employees)
Of all the customers that are using Visual KPI, a majority (57%) are large (>1000 employees), 7% are small (<50 employees) and 31% are medium-sized.
Distribution of companies that use Visual KPI based on company size (Revenue)
Of all the customers that are using Visual KPI, a majority (65%) are large (>$1000M), 18% are small (<$50M) and 12% are medium-sized.
