Companies using Tableau Desktop
We have data on 7,704 companies that use Tableau Desktop. The companies using Tableau Desktop are most often found in United States and in the Information Technology and Services industry. Tableau Desktop is most often used by companies with 1000-5000 employees and >1000M dollars in revenue. Our data for Tableau Desktop usage goes back as far as 7 years and 7 months.
If you’re interested in the companies that use Tableau Desktop, you may want to check out Tableau and Microsoft power BI as well.
Who uses Tableau Desktop?
| Company | Grover |
| Website | grovercorp.com |
| Country | United States |
| Revenue | 100M-200M |
| Company Size | 50-200 |
| Company | Mohawk Industries, Inc. |
| Website | mohawkind.com |
| Country | United States |
| Revenue | >1000M |
| Company Size | >10000 |
| Company | Pure Storage Inc |
| Website | purestorage.com |
| Country | United States |
| Revenue | >1000M |
| Company Size | 5000-10000 |
| Company | Third Republic |
| Website | thirdrepublic.co |
| Country | South Africa |
| Revenue | 0M-1M |
| Company Size | 1-10 |
| Company | Hermes Europe |
| Website | hermesworld.com |
| Country | Germany |
| Revenue | >1000M |
| Company Size | 1000-5000 |
| Company | Website | Country | Revenue | Company Size |
|---|---|---|---|---|
| Grover | grovercorp.com | United States | 100M-200M | 50-200 |
| Mohawk Industries, Inc. | mohawkind.com | United States | >1000M | >10000 |
| Pure Storage Inc | purestorage.com | United States | >1000M | 5000-10000 |
| Third Republic | thirdrepublic.co | South Africa | 0M-1M | 1-10 |
| Hermes Europe | hermesworld.com | Germany | >1000M | 1000-5000 |
Target Tableau Desktop customers to accomplish your sales and marketing goals.
Tableau Desktop Market Share and Competitors in Business Intelligence
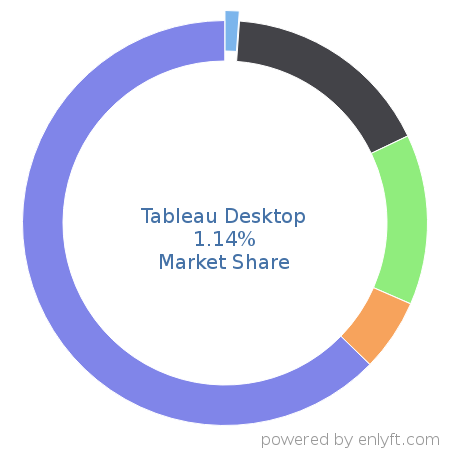
We use the best indexing techniques combined with advanced data science to monitor the market share of over 15,000 technology products, including Business Intelligence. By scanning billions of public documents, we are able to collect deep insights on every company, with over 100 data fields per company at an average. In the Business Intelligence category, Tableau Desktop has a market share of about 1.1%. Other major and competing products in this category include:
Business Intelligence

What is Tableau Desktop?
Tableau Desktop is a powerful data discovery and exploration application that allows you to answer pressing questions in seconds. Tableau Desktop's drag & drop interface lets you visualize any data, explore different views, and even combine multiple databases together with a few clicks.
Top Industries that use Tableau Desktop
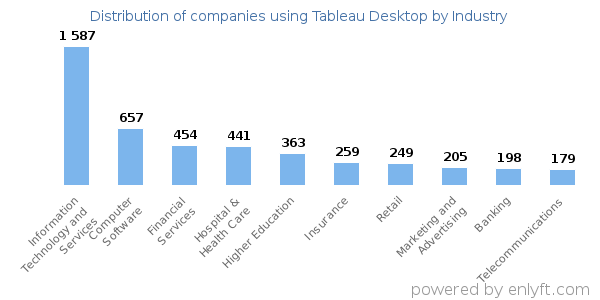
Looking at Tableau Desktop customers by industry, we find that Information Technology and Services (19%), Computer Software (8%), Financial Services (6%) and Hospital & Health Care (5%) are the largest segments.
Top Countries that use Tableau Desktop
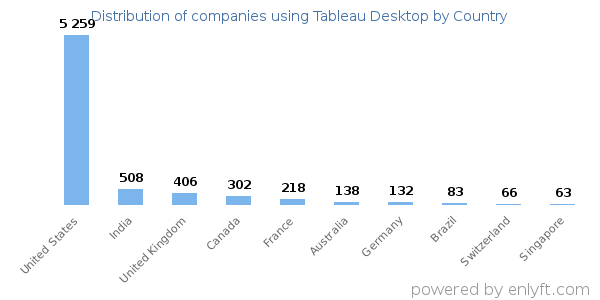
63% of Tableau Desktop customers are in United States, 6% are in India and 5% are in United Kingdom.
Distribution of companies that use Tableau Desktop based on company size (Employees)
Of all the customers that are using Tableau Desktop, 17% are small (<50 employees), 37% are medium-sized and 46% are large (>1000 employees).
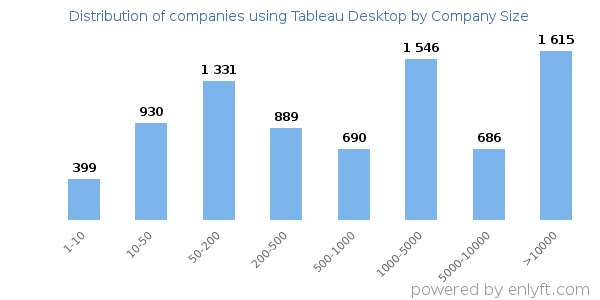
Distribution of companies that use Tableau Desktop based on company size (Revenue)
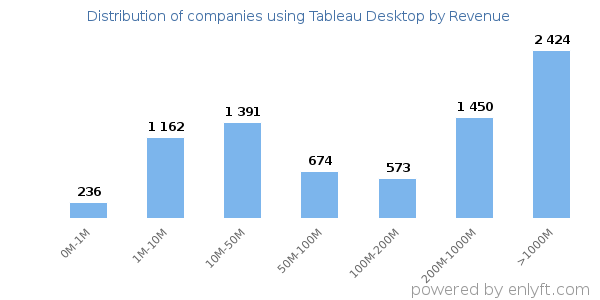
Of all the customers that are using Tableau Desktop, 33% are small (<$50M), 17% are medium-sized and 47% are large (>$1000M).
