Companies using CA RC/Migrator
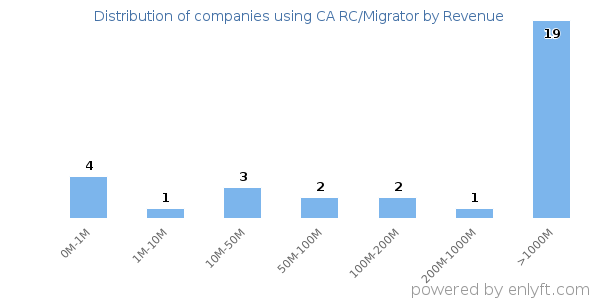
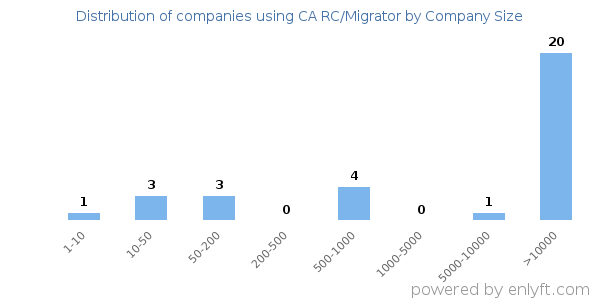
We have data on 32 companies that use CA RC/Migrator. The companies using CA RC/Migrator are most often found in United States and in the Financial Services industry. CA RC/Migrator is most often used by companies with >10000 employees and >1000M dollars in revenue. Our data for CA RC/Migrator usage goes back as far as 9 years and 4 months.
If you’re interested in the companies that use CA RC/Migrator, you may want to check out Amazon API Gateway and SQL Server Integration Services (SSIS) as well.
Who uses CA RC/Migrator?
| Company | AT&T Inc |
| Website | att.com |
| Country | United States |
| Revenue | >1000M |
| Company Size | >10000 |
| Company | HCL Infosystems Ltd. |
| Website | hclinfosystems.com |
| Country | India |
| Revenue | 200M-1000M |
| Company Size | >10000 |
| Company | JPMorgan Chase & Co. |
| Website | jpmorganchase.com |
| Country | United States |
| Revenue | >1000M |
| Company Size | >10000 |
| Company | Laboratory Corporation of America Holdings |
| Website | labcorp.com |
| Country | United States |
| Revenue | >1000M |
| Company Size | >10000 |
| Company | CW&T |
| Website | cwandt.com |
| Country | United States |
| Revenue | 0M-1M |
| Company Size | 10-50 |
| Company | Website | Country | Revenue | Company Size |
|---|---|---|---|---|
| AT&T Inc | att.com | United States | >1000M | >10000 |
| HCL Infosystems Ltd. | hclinfosystems.com | India | 200M-1000M | >10000 |
| JPMorgan Chase & Co. | jpmorganchase.com | United States | >1000M | >10000 |
| Laboratory Corporation of America Holdings | labcorp.com | United States | >1000M | >10000 |
| CW&T | cwandt.com | United States | 0M-1M | 10-50 |
Target CA RC/Migrator customers to accomplish your sales and marketing goals.
CA RC/Migrator Market Share and Competitors in Data Integration
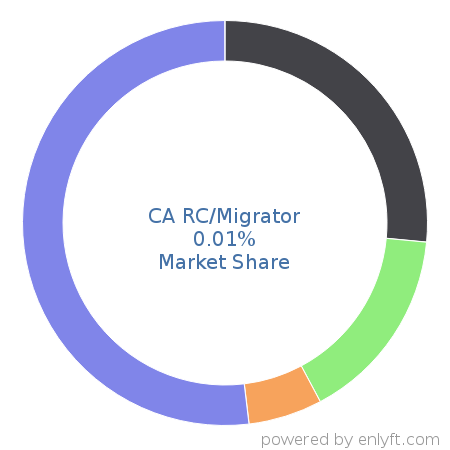
We use the best indexing techniques combined with advanced data science to monitor the market share of over 15,000 technology products, including Data Integration. By scanning billions of public documents, we are able to collect deep insights on every company, with over 100 data fields per company at an average. In the Data Integration category, CA RC/Migrator has a market share of about 0.1%. Other major and competing products in this category include:
Data Integration

What is CA RC/Migrator?
CA RC/Migrator is the product of choice for performing DB2 migrations, alterations, and subsystem and DDL file comparisons. It automates the process of migrating and altering DB2 objects, data, and security. With the addition of the Compare Facility, a separate component, provides the automatic comparison and synchronization of your DB2 subsystems or DDLfiles.
Top Industries that use CA RC/Migrator
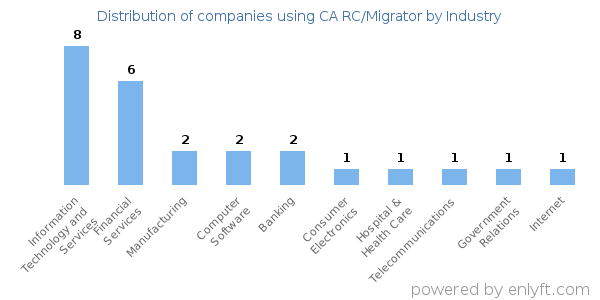
Looking at CA RC/Migrator customers by industry, we find that Financial Services (16%), Information Technology and Services (16%) and Banking (7%) are the largest segments.
Top Countries that use CA RC/Migrator
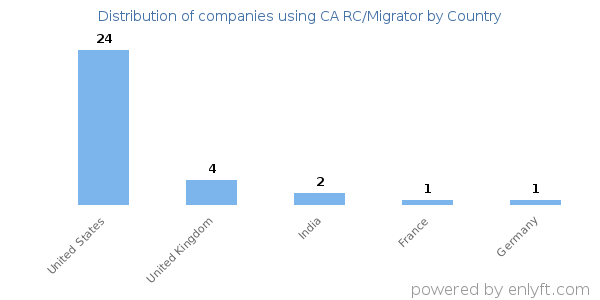
69% of CA RC/Migrator customers are in United States and 13% are in United Kingdom.
Distribution of companies that use CA RC/Migrator based on company size (Employees)
Of all the customers that are using CA RC/Migrator, a majority (51%) are large (>1000 employees), 8% are small (<50 employees) and 22% are medium-sized.
Distribution of companies that use CA RC/Migrator based on company size (Revenue)
Of all the customers that are using CA RC/Migrator, 13% are small (<$50M), 7% are medium-sized and 48% are large (>$1000M).
