Companies using AWS Cost & Usage Report
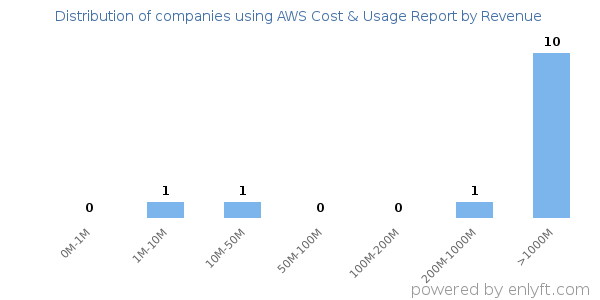
We have data on 16 companies that use AWS Cost & Usage Report. The companies using AWS Cost & Usage Report are most often found in United States and in the Computer Software industry. AWS Cost & Usage Report is most often used by companies with >10000 employees and >1000M dollars in revenue. Our data for AWS Cost & Usage Report usage goes back as far as 6 years and 6 months.
If you’re interested in the companies that use AWS Cost & Usage Report, you may want to check out SAP Crystal Reports and Microsoft SQL Server Reporting Services as well.
Who uses AWS Cost & Usage Report?
| Company | Roku Inc |
| Website | roku.com |
| Country | United States |
| Revenue | >1000M |
| Company Size | 1000-5000 |
| Company | The University of Texas at Dallas |
| Website | utdallas.edu |
| Country | United States |
| Revenue | 200M-1000M |
| Company Size | 5000-10000 |
| Company | Capital One Financial Corporation |
| Website | capitalone.com |
| Country | United States |
| Revenue | >1000M |
| Company Size | >10000 |
| Company | The Hartford Financial Services Group, Inc. |
| Website | thehartford.com |
| Country | United States |
| Revenue | >1000M |
| Company Size | >10000 |
| Company | Verisk Analytics, Inc. |
| Website | verisk.com |
| Country | United States |
| Revenue | >1000M |
| Company Size | 5000-10000 |
| Company | Website | Country | Revenue | Company Size |
|---|---|---|---|---|
| Roku Inc | roku.com | United States | >1000M | 1000-5000 |
| The University of Texas at Dallas | utdallas.edu | United States | 200M-1000M | 5000-10000 |
| Capital One Financial Corporation | capitalone.com | United States | >1000M | >10000 |
| The Hartford Financial Services Group, Inc. | thehartford.com | United States | >1000M | >10000 |
| Verisk Analytics, Inc. | verisk.com | United States | >1000M | 5000-10000 |
Target AWS Cost & Usage Report customers to accomplish your sales and marketing goals.
AWS Cost & Usage Report Market Share and Competitors in Reporting Software
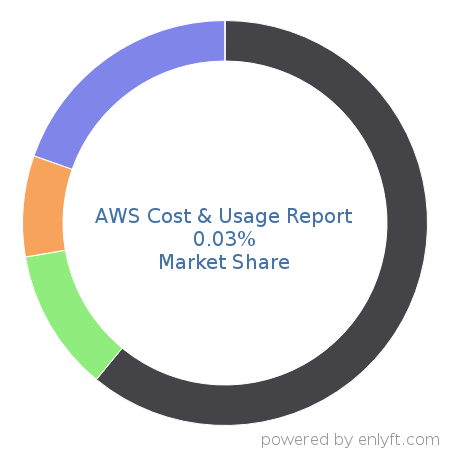
We use the best indexing techniques combined with advanced data science to monitor the market share of over 15,000 technology products, including Reporting Software. By scanning billions of public documents, we are able to collect deep insights on every company, with over 100 data fields per company at an average. In the Reporting Software category, AWS Cost & Usage Report has a market share of about 0.1%. Other major and competing products in this category include:
Reporting Software

What is AWS Cost & Usage Report?
The AWS Cost & Usage Report is a single location for accessing comprehensive information about your AWS costs and usage. The AWS Cost & Usage Report lists AWS usage for each service category used by an account and its IAM users in hourly or daily line items, as well as any tags that you have activated for cost allocation purposes. You can also customize the AWS Cost & Usage Report to aggregate your usage data to the daily or monthly level.
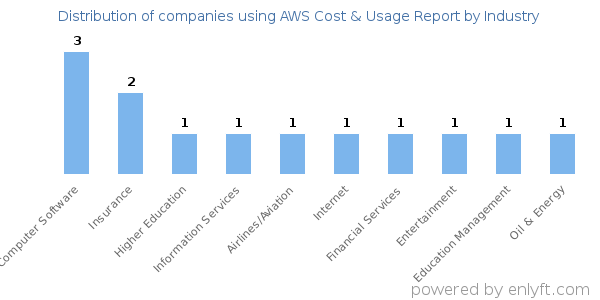
Top Industries that use AWS Cost & Usage Report
Looking at AWS Cost & Usage Report customers by industry, we find that Computer Software (19%), Insurance (7%) and Information Technology and Services (7%) are the largest segments.
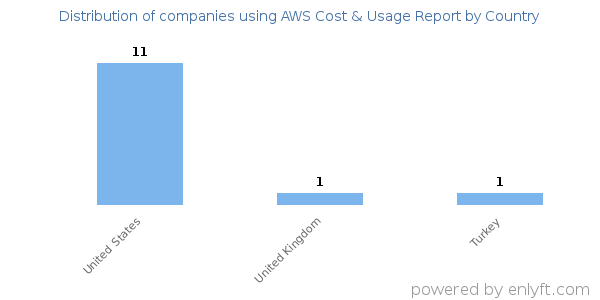
Top Countries that use AWS Cost & Usage Report
77% of AWS Cost & Usage Report customers are in United States.
Distribution of companies that use AWS Cost & Usage Report based on company size (Employees)
Of all the customers that are using AWS Cost & Usage Report, a majority (60%) are large (>1000 employees), 14% are small (<50 employees) and 1% are medium-sized.
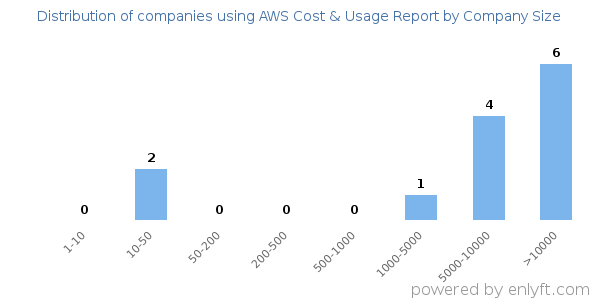
Distribution of companies that use AWS Cost & Usage Report based on company size (Revenue)
Of all the customers that are using AWS Cost & Usage Report, a majority (66%) are large (>$1000M), 14% are small (<$50M) and 0% are medium-sized.
